In this post we are going to explore signal generation through GNU-Radio and how we can visualize it in the time and frequency domains.
Precisely, we are going to generate a sinusoid at a particular frequency using GNU-Radio blocks visualized as time-domain signals, and add another sinusoid at a desired frequency in the frequency domain.
GNU Radio is an open source software that provides tools for learning and implementing Software Defined Radio. Out of the box, it provides many functional blocks which one can connect in the form of a flowgraph to achieve something. It would be better to explain with an example, so we will dive right in. But before that, be advised that what we cover here isn't precise - it may be highly simplified for the sake of building intuition.
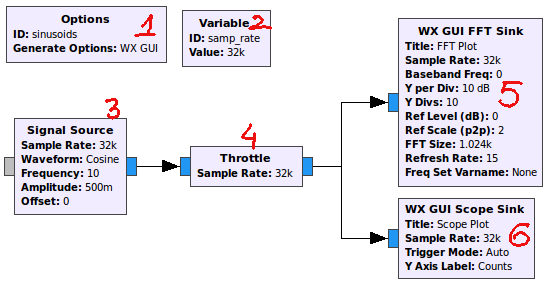
So, let's build our flowgraph to do a very simple experiment. Generate a sinusoid, and visualize it on an oscilloscope. Both of these are available inside GNURadio. The GUI named GNU Radio Companion is particularly suited for such simple designs. So, here is our simple flowgraph:
Here is a pointwise explanation:
1. Consider it to be the main() or the master class of your flowgraph for all functional purposes. The GNU Radio software would create a Python script by the name you specify as 'id' here. Further, there are two kind of visualizing libraries in play: WX and QT. We can't mix the two. So, here, we select WX GUI components.
2. This is a variable block. Now, since we are doing everything in the digital domain as per se, we need to create all signals - even the analog signals in the digital domain. The rate of sample generation is determined by the variable samp_rate (which we shall refer to as sampling rate). We leave it at its default value: 32k - 32,000 samples per second.
3. This is a signal source block. Here, we've specified through interactive menus that we want a cosine wave, with an amplitude of 0.5 units with a frequency of 10 Hz.
4. Throttle: This is an extraneous block. In a purely software based environment, we wouldn't want this script to completely occupy the CPU and make the rest of the processes extremely slow. So, to kind of rate-limit the process to use only as much as it is supposed to and then let other processes function, we have this block. This is not needed in case we hook up an actual hardware as source or sink - because hardware interaction is controlled automatically.
5. FFT Sink: This is the block to see the frequency domain representation of the signal fed into it. Think of it as a digital spectrum analyser.
6. Scope Sink: This is the block representing the time domain Oscilloscope function (where we see the curvy sinusoid).
Running this flowgraph would yield something like this:

Note that we have increased the seconds per division in the scope plot to see some cycles.
That was easy, wasn't it!
Now, under the hood, GNU Radio has been written mostly in C++ and Python. The flowgraphs that you have created are actually directions on how the GUI should render them. For example, if you save the above flowgraph, it would be saved as a *.grc extension file. But if you open it in a text editor, it is the good old XML! This XML merely specifies the layout of the blocks and what values to put inside them. More so, it just contains (key,value) pairs - mostly. Here's a snippet:
<?xml version='1.0' encoding='utf-8'?>
<?grc format='1' created='3.7.11'?>
<flow_graph>
  <timestamp>Sat Feb  4 12:44:10 2017</timestamp>
  <block>
    <key>options</key>
    <param>
      <key>author</key>
      <value></value>
    </param>
    <param>
      <key>window_size</key>
      <value></value>
    </param>
    <param>
      <key>category</key>
      <value>[GRC Hier Blocks]</value>
    </param>
    <param>
      <key>_coordinate</key>
      <value>(8, 8)</value>
    </param>
    <param>
      <key>_rotation</key>
      <value>0</value>
    </param>
    <param>
      <key>generate_options</key>
      <value>wx_gui</value>
    </param>
    <param>
When 'compiled', what it creates is a script in python which will eventually run the entire thing. We'll look into that in our next post when we delve into the code directly from here and start fiddling with the signal in the frequency domain.
The Complete Flowgraph for this post can be seen here.